


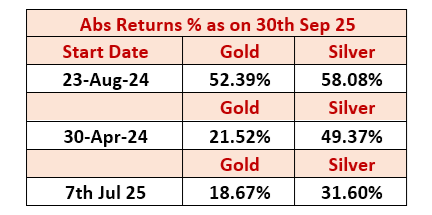
I had written about investing in Gold & Silver on various dates: 23rd Aug 24, 30th Apr 25 and 7th Jul 25 when Gold was at $2500/oz and Silver was at $29/oz (on 25th Aug 24) and rising with Gold to Silver ratio at 84. Post that, Gold to Silver ratio went up to 101 by 30th April 2025. Gold has now moved to historical high of $3865/oz and Silver has moved to $47.10/oz, with Gold to Silver ratio having come down to 82.
This is what I had stated in my notes:
- The gold-to-silver ratio is an important measure of the relative gold and silver prices. It compares the amount of silver required to buy one ounce of gold
- The ratio can be used to help determine whether to focus on buying physical gold or silver. For example, a popular rule of thumb is the "80/50" rule, which suggests switching to silver when its value rises above 80 ounces of silver per 1 ounce of gold, and switching to gold when its value drops below 50 ounces per 1 ounce
Returns in respective metals since those dates to 30th September 2025 is:
Where do we go from here? Is it time to book profits, add Gold or add Silver? Switch from Gold to Silver? Many such questions are plaguing minds of investors.
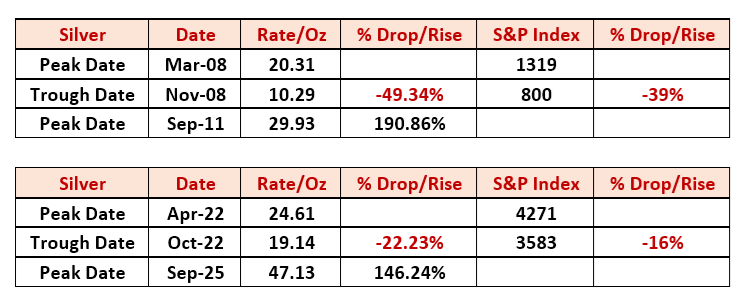
First and foremost, let me reiterate the downside. If markets in the USA correct, all other asset classes correct along with that and may be to the same extent. However, rally in precious metals thereafter, goes to the next level:
Let us first analyze the technical analysis in Silver:
The 45-year cup and handle technical pattern in silver identifies major long-term resistance and support zones, signalling critical levels that traders and investors are closely watching.
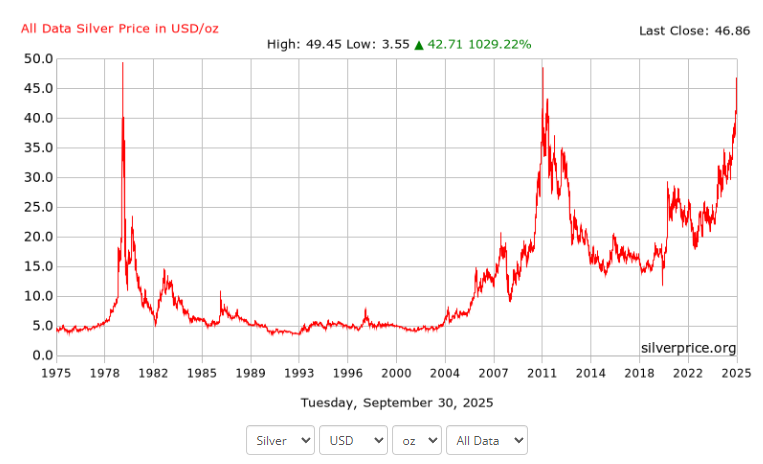
- The most important resistance is at the $49–$50 per ounce region, which marked silver’s all-time highs in both 1980 and 2011, and has repeatedly capped price advances for over four decades
- If silver breaks above this level and can hold for several consecutive weeks or months, it would confirm a major long-term breakout, transforming this resistance into new support level
- A confirmed, sustained breakout above $50/oz(followed by strong volume and price stability) may launch silver into a new secular bull market and attract significant institutional capital
Now let us analyze the Fundamentals as well:
- As of August 2025, the United States has added silver to its draft list of critical minerals for the first time. Silver’s new status as a “critical mineral” means it is now recognized as essential to the U.S. economy and national security, with an increased risk of supply chain disruption
- Central governments including Saudi Arabia, Russia, and China have begun accumulating silver for their reserves in 2025—a major development not seen in decades. This marks a strategic shift as these countries diversify beyond gold, motivated by both industrial demand growth and supply concerns
- The steady multi-year silver supply deficit driven by structural supply constraints and surging industrial plus investment demand is creating heightened market tension
- This persistent shortfall propels price appreciation and raises the likelihood of renewed interest from investors, governments, and industries to secure silver supply
Short Squeeze in Silver:
- Banks and large institutions, particularly bullion banks like JPMorgan, UBS, and HSBC, have long held significant short positions in silver futures—amounting to over 200 million ounces or roughly 20-25% of annual global silver production. This heavy short-selling pressure has been a key factor in suppressing silver prices artificially, a practice often described as manipulation. Notably, there have been convictions for price manipulation and spoofing in precious metals markets, underscoring the credibility of these allegations
- A silver short squeeze occurs when rising demand for physical silver forces short sellers to buy back their positions at higher prices, causing a rapid price spike. In 2025, several signs indicate increasing short squeeze pressure: strong industrial demand, supply deficits, rising physical premiums, shrinking inventories, and technical breakouts. The paper-to-physical silver ratio remains extraordinarily high at around 378:1, meaning there are many more paper claims than actual physical silver, amplifying squeeze potential
Finally, to conclude, when the Gold to Silver ratio breaches 75, first phase of Gold rally is supposed to be over. This is the time to shift focus away from Gold and get into Silver. 30-year historical average of Gold to Silver is 68. Even assuming gold price to go up to $4,000/oz, at 68:1 ratio, Silver should touch $58/oz soon from the current levels of $47/oz. Investors have to know price movements in Silver are extremely volatile as shown in the table above. One will need to ride such volatility, as and when that happens to come out on top.