


Reality of Amrit Kal - Is India Totally Decoupled from Global Factors?
Current Global Macros and Geo Political situation and its impct on Equity markets:
Fed paused rate hikes in their last FOMC meet. Inflation is reducing. Markets are taking a cue from this and getting back to Risk On mode. Wall Street has been publishing scores of bulilish stock market out look for 2024. Analysts expect lower inflation, lower interest rates, resilient consumers and strong returns for big Tech.
So far, we have seen disinflation, mainly driven by supply side with a big post pandemic rebound in production and productivity. What will be a worry in 2024 is demand side story – which is not as rosy as what people are expecting. And that is bad disinflation.
This may be good for bond markets but negative for equity markets where demand will slow down, inventory will start piling up, margins will be squeezed and have negative impact on corporate balance sheets (Bull whip effect – what Michael Burry had pointed out last year).
Many US retail giants have forecasted that consumer spending is slowing down. Best Buy Co. lowered its forecast and cited “uneven consumer demand” heading into holiday sesaon. Lowe’s Cos. cut its outlook on lower than expected sales. These are similar comments to what we have already heard from Walmart,Inc., Macy’s Inc., Home Depot and others.
Add to the above folllowing other data points which are pointing towards slowing US economy v/s alternative narratives of expanding US economy:
From USA Context:
- M2 Money Supply in US is contracting at the fastest pace ever:
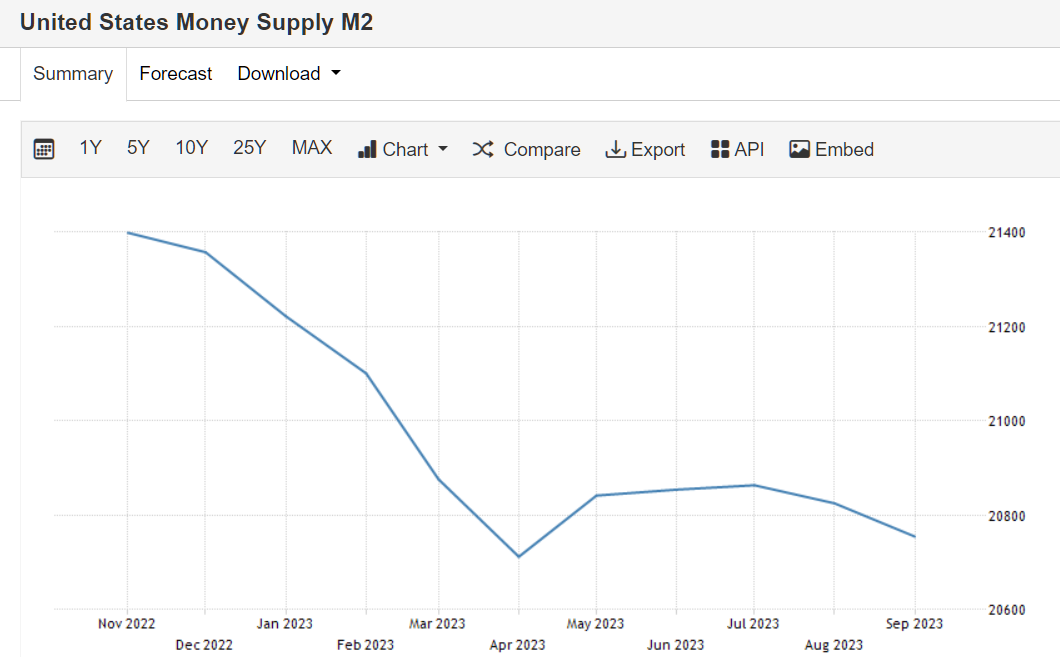
Source: https://tradingeconomics.com
- Savings as % of national income is contracting: Over the pandemic, historic levels of government transfers boosted household income while household spending was severely curtailed by social distancing. This led the personal saving rate to soar (Figure 1), and we estimate that U.S. households accumulated about $2.3 trillion in savings in 2020 and through the summer of 2021, above and beyond what they would have saved if income and spending components had grown at recent, pre-pandemic trends. Since late last year, households have decumulated about one-quarter of these excess savings, as the saving rate has dropped below its pre-pandemic trend. Previous two such contractions led to 2008 Financial Crisis and 2020 Pandemic. If US goes into recession with lowering savings, it will have accentuated impact on households spending capacities
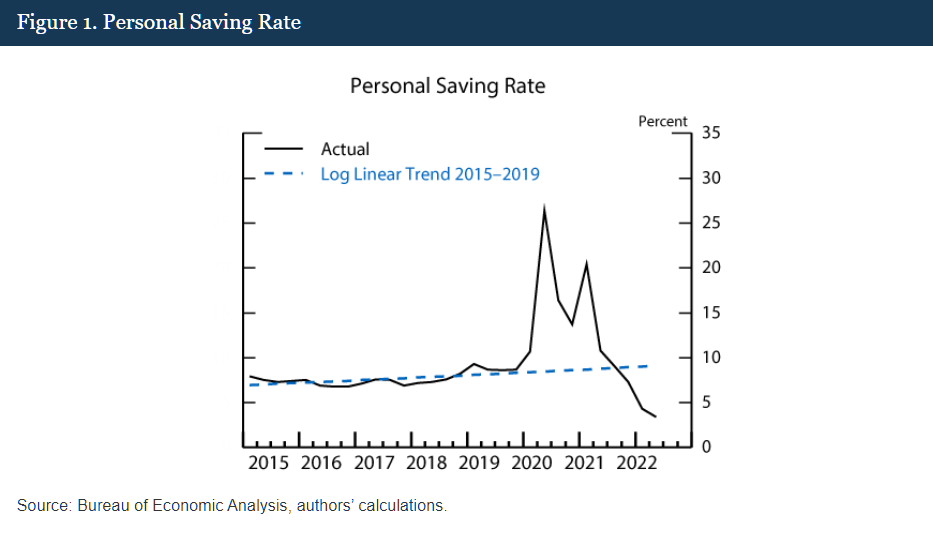
Siurce: https://www.federalreserve.gov
- Higer interest rates for longer periods: is a big dampner on consumer spending, housing mortgage EMIs, and much more. US Fed Fund rate is at same high levels last seen in 2008 Financial Crisi times. There is always that lag effect on when Fed raises rates and its impact on Corporate Balance Sheets:
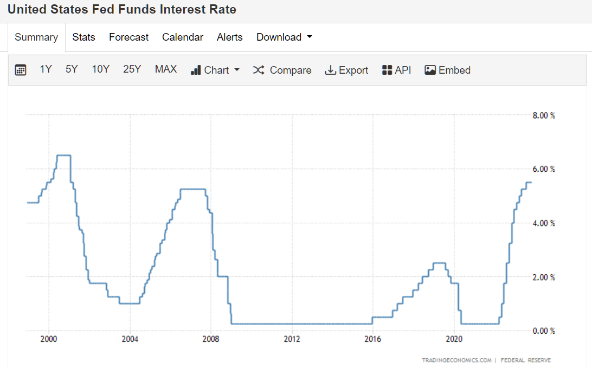
Source: https://tradingeconomics.com
- 10 Year – 2 Year US Treasury yield spread is negative – implying imminent recession over next 6 to 12 months. Generally, banks borrow short and lend long. When short term rates go up, they stop borrowing and lending – contracting credit which leads to slowing economy and recession. Since May 2022, yield curve has inverted and stays inverted for the longest possible time in recent history. Also, post yield curve inversion, if yield curve starts to steepen rapidly (as was seen in October 2023), economy may be closer to recession
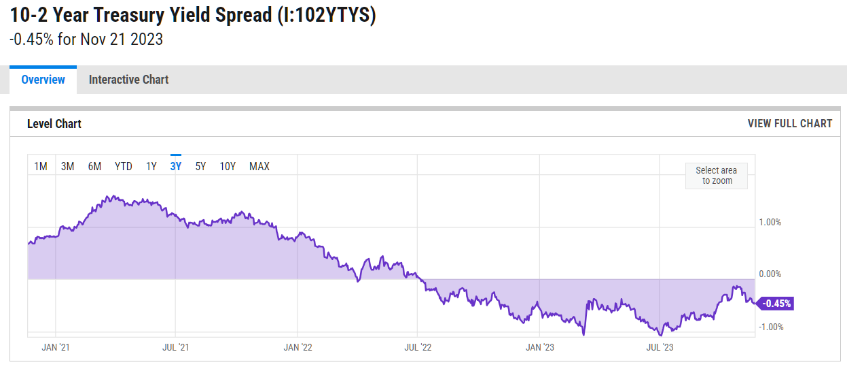
Source: https://ycharts.com
- Banks Tightening Lending – Credit contraction leads to recession. US banks have been gradually reducing credit supply for the last 18 months, reflecting a weaker and more uncertain macro-outlook and reduced tolerance for risk. A net 43.8% of banks reported tightening lending standards for small firms in Q1 2023, up from 31.8% in Q4 2022:
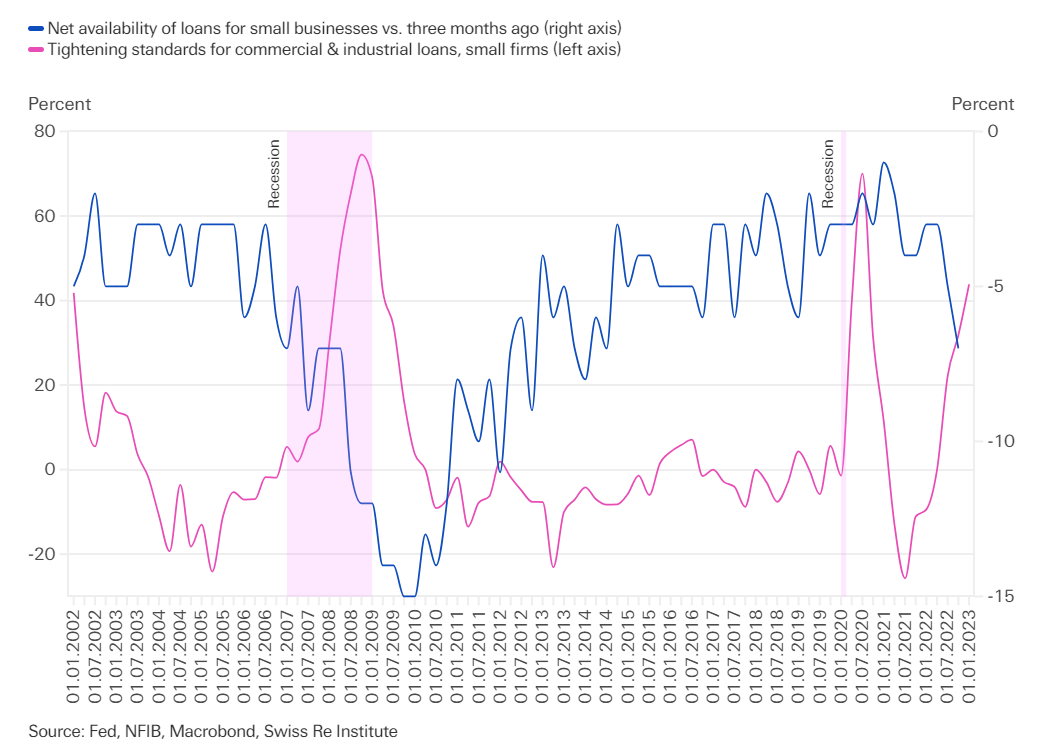
Source: https://www.swissre.com
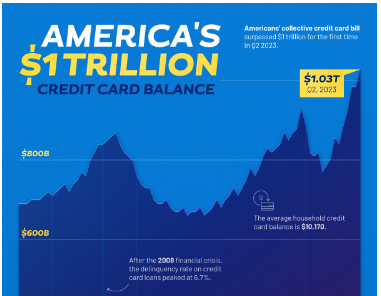
- Credit Card debt: has now crossed $1 trillion. Credit Card default rate is rising rapidly. After a sharp contraction in the first year of the pandemic, credit card balances have experienced seven consecutive quarters of year-over-year growth. In Q2 2023, credit card balances saw the most significant increase among all debt types, including auto loans, student loans, and mortgages. The average household credit card balance was $10,173.87 in June, $2,242.77 below the record set in Q4 2007. As the Federal Reserve has increased interest rates at a record pace, banks have followed suit. The average credit card charges around 21% interest rate on overdue payments, nearly five percentage points higher than in 2022:
- US Debt: From FY 2019 to FY 2021, spending increased by about 50%, largely due to the COVID-19 pandemic. Tax cuts, stimulus programs, increased government spending, and decreased tax revenue caused by widespread unemployment generally account for sharp rises in the national debt:
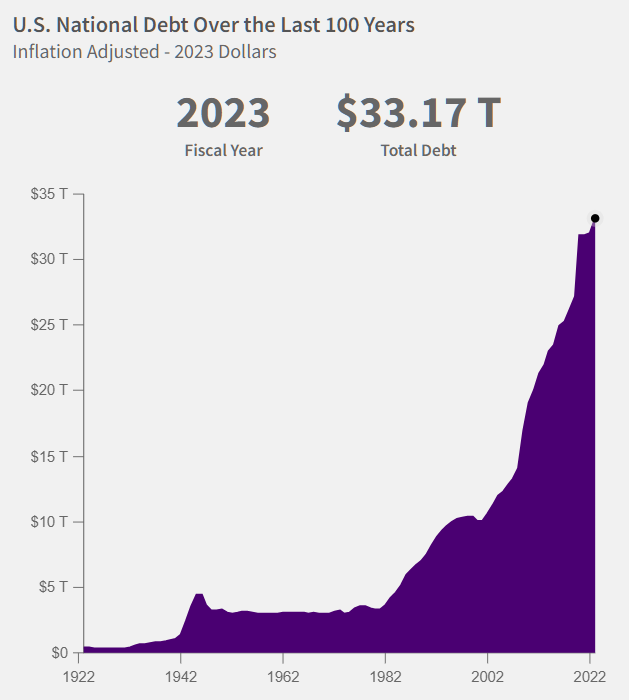
Source: https://fiscaldata.treasury.gov
- Debt to GDP ratio is also at an all time high:
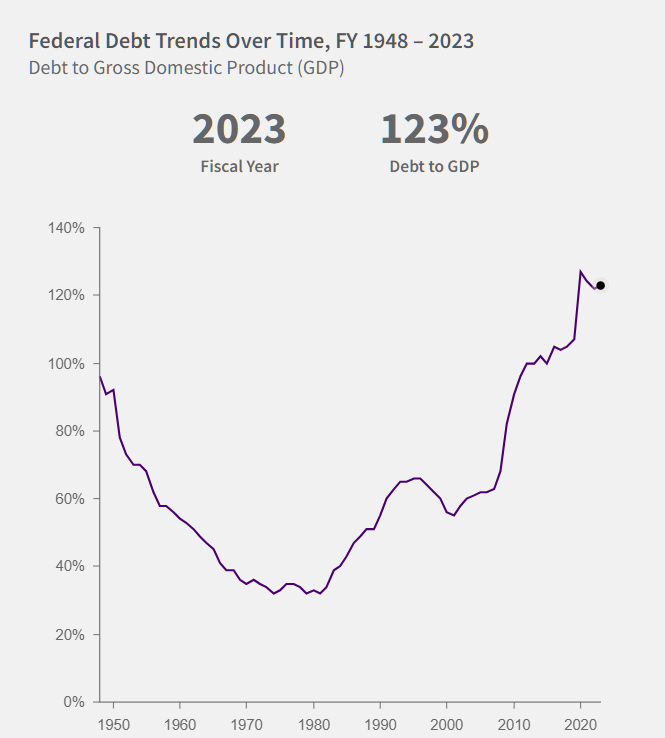
Source: https://fiscaldata.treasury.gov
One of the main causes of the jump in public debt can be attributed to increased funding of programs and services during the COVID-19 pandemic.
- US Home Sales Contracting: US existing home sales dropped to the lowest level in more than 13 years in October as the highest mortgage rates in two decades and a dearth of houses drove buyers from the market. Existing home sales tumbled 4.1% last month to a seasonally adjusted annual rate of 3.79m units, the lowest level since August 2010.
From Indian Context:
- Decline in Sales & Growth: and rising interest rates could trigger decline in equity market valuations
- Small Caps: when small caps delivered returns far above base rates (>35%) over 3 years, next 7 year forward returns were abysmally low (< 5%)
- From TINA to RINA: when interest rates were at near zero in US, narrative was TINA (There is No Alternative) to Equity investing. Now the same narrative has changed to RINA post interest rates rising viz. reasonabe interest rate now available with rates at multi decade high
- Small Caps and Mid Caps: will have to go through either time correction (consolidation for a few years) or price correction with India amongst most expensive markets globally
- Silver lining in all the above chaos is Amrit Kal in India and India shining story with 6 to 7% GDP growth – highest in Global context
- India will continue to attract higher premium amongst emerging market countries and attract more inflows as and when Global situation improves
- India will be and is a big beneficiary of China + 1 alternative
- Domestic flows, retail investments (visible in 16,000 Crs monthly SIP book) is a great cushion to absorb negative impacts of FII/FPIs pulling out
- Any corrections can only give rise to great investment opportunities in Indian markets
Geo Political Context:
- Hamas Israel war has created geo political issues in middle east with possibility of many more countries getting invoved in the conflict
- Russia-Ukraine war continues to be on the boil
- This will have negative impact on Crude Oil, Dollar Index, Interet rates, inflation, etc.
Elections in US and India in 2024:
- Markets will be volatile over next 6 to 12 months not only due to US factors, geo politicals factors but also due to elections in both US and India in 2024
Conclusion:
- Do not ignore these data points of US economy, Indian economy, geo political issues and election impact on markets
- Markets will be in volatile zones over 6 to 12 months and will give ample opportunities for investing – keep some dry powder in your portfolios ready to take advantage of these opportunities
- Not the right time to be totally Risk On. Respect market signals and invest based on valuations
- Large and Mega caps are better valued than Small and Mid Caps at current juncture