


We have been listening to the narratives of how Indian markets are more resilient than other global markets. How Indian Equity markets have fallen the least among other emerging markets as well as the strength of INR vis a vis other global currencies v/s Dollars.
I totally agree with these narratives to start with. I have no dispute on India shining story, best destination for foreign funds to invest with much better macros and better inflation management v/s the rest of the world. India managed to come out of the Pandemic situation in a much better way as we did not print money, did not resort to fiscal stimulus (putting money directly in accounts of the citizens) – which in turn helped in managing fiscal deficit and avoiding inflation in different asset classes including Debt, Equity and Real Estate.
Just the opposite has happened in other western countries including US and Europe where Central Banks printed trillions of dollars (printed money) to come out of recession which would have set in post COVID lockdowns in March 2020. They resorted to helicopter money through Quantitative Easing (QE), printing dollars and fiscal stimulus by putting money directly in the bank acounts of their citizens. Since, citizens were under lock down with limited requirements and flushed with funds (due to fiscal stimulus), they started dabbling in equity, cryptos, real estate and other asset classes including luxury items.
Demand push and supply constraints due to supply chain issues created by lock downs and now Russia-Ukraine war – escalated only the asset prices to astronomical levels but also created inflationary pressures in the respective economies. Inflation in US and European countries are at multi decade (almost 4 decade) highs with benign interest rates to start with. 40 years back when inflation was at these levels, interest rates in US were in double digit figures v/s zero interest rate policy just a year back.
To begin with Fed was in denial mode stating that inflation is transitory and will pass away soon once supply chain bottlenecks were lifted. Reality hit them when they realized that inflation was now here to stay and they will have to combat that by raising rates and cooling off economies and at the same time start sucking out liquidity (main cause for this inflation to have become sticky).
Now there will be double whammy of a) rising interest rates and b) Quantitative Tightening (QT) to suck out liquidity to tame inflation and bring it within the comfort zone of Fed at 2% (v/s current level of 8.30%). Generally, rate hikes have some time lags of almost 9-12 months to showcase significant impact on bottom lines of companies. Just a year back interest rates were at near zero levels and now likely to be in higher 3% to 4% levels by 2023 when Fed would have resorted to a few more rate hikes. Naturally earnings of the companies will take a huge hit going forward. Hence, instead of EPS rising, one should expect earnings to be on the lower side going into 3rd and 4th quarter of 2022.
As per estimates by Charlie Billelo (Founder and CEO of Compound Capital Advisors) - even housing markets in US will take a huge hit as monthly mortgage payment on the median home for sale in the US has increased 42.5% over last year (from $1674 to $2385) as mortgage rates have gone up from 2.86% to 6.02% . Also, according to him, this has been the worst year for US 60/40 portfolio (60% - S&P 500 and 40% Bloomberg US Agg) – delivering -13.90% YTD till August 2022:
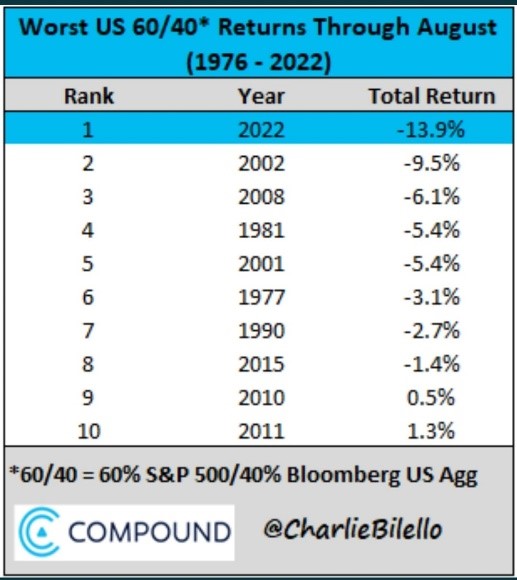
This data shows that in US, there has been blood bath both in debt and equity – reason why 60:40 portfolio has shown its worst YTD performance since 1977.
Now let us look at some of the important Macro data and analyze as to what it means and predicts – post that I will comment on how what these indicators mean for Indian investors:
- Dollar Index:
- What is Dollar Index? As per Investopedia: The U.S. dollar index (USDX) is a measure of the value of the U.S. dollar relative to a basket of foreign currencies. The USDX was established by the U.S. Federal Reserve in 1973 after the dissolution of the Bretton Woods Agreement. Currencies included in Dollar Index are - the Euro, Swiss franc, Japanese yen, Canadian dollar, British pound, and Swedish krona
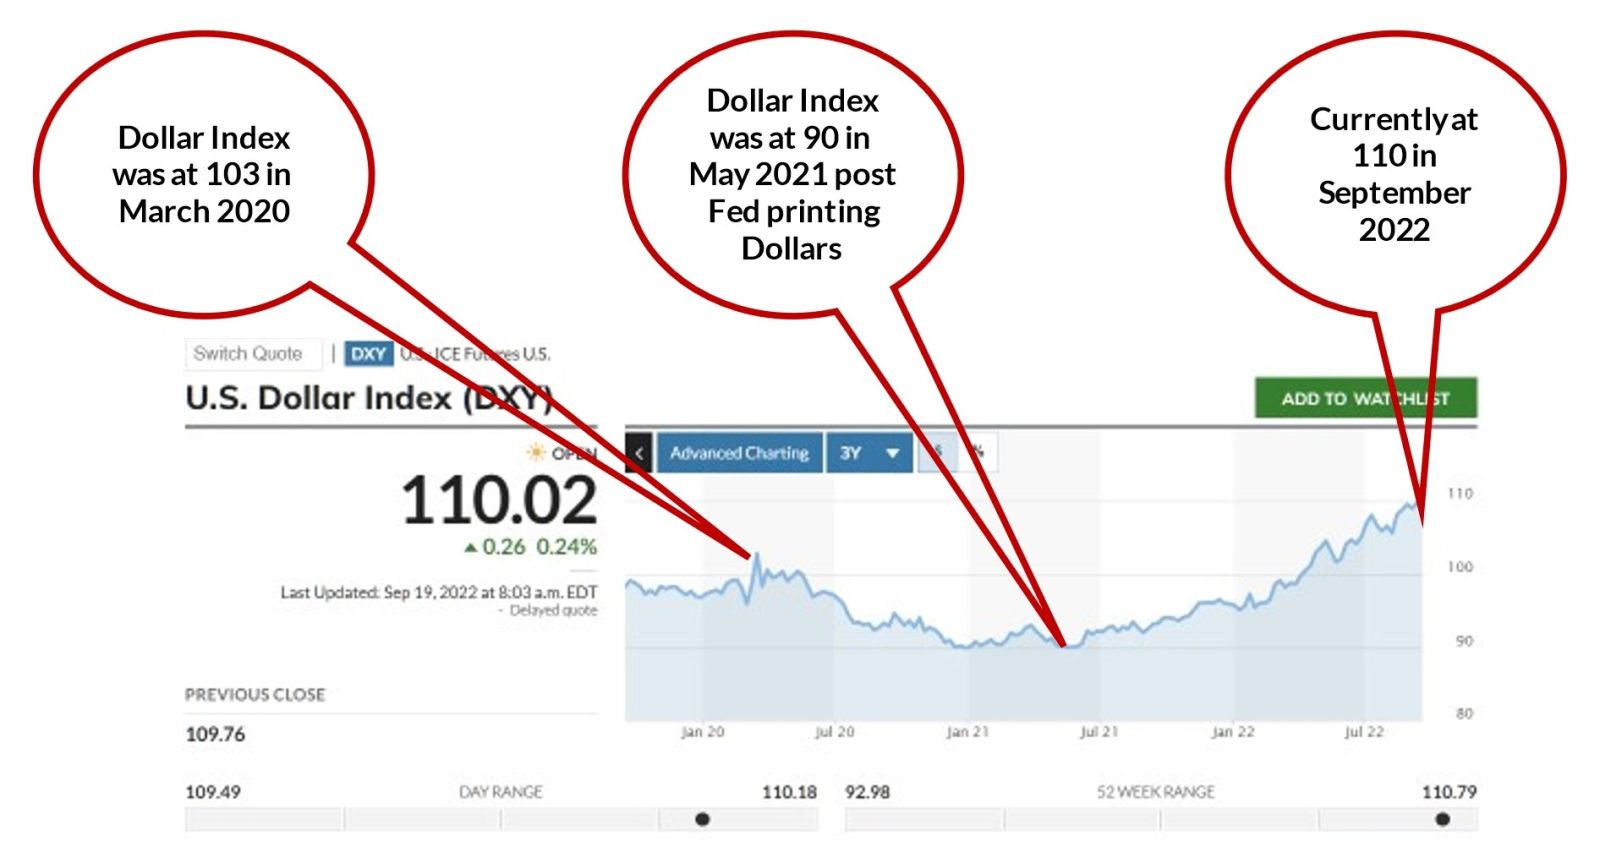
- This Index shows relative strength of US Dollars v/s other six currencies pegged against it. In March 2020 post COVID break out and subsequent lock downs, Dollar Index had risen to a high of 103 – indicating flight to liquidity i.e., most asset classes were sold at that time getting converted to US Dollars; thereby strengthening USD v/s other currencies
- It fell to a new low of 90 by May 2021, when Fed started printing dollars and announced Fiscal Stimulus to counter imminent recession. That period indicated losing strength of dollar due to excessive printing. When once again there is talk of recession in US, China, EU – most asset classes are getting beaten down including Equity, Debt, Real Estate, Cryptos and funds are moving back into Dollars. This is when Dollar Index has scaled new highs of 110 in September 2022 – which is not good for emerging markets (including India) as funds will flow out of emerging markets equity and get back into Dollars
- Inflation in US:
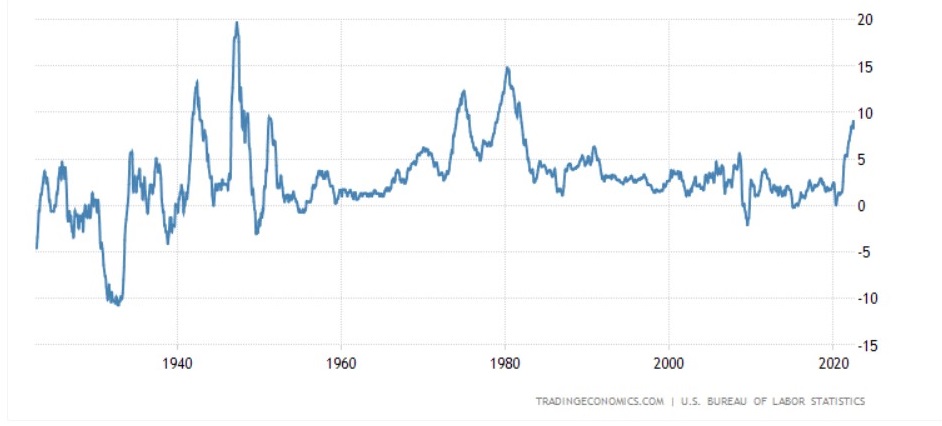
- For the longest period of time, US Inflation was within the comfort zone of Fed – in 2% region. Post Pandemic, Quantitative Easing (QE), dollar printing, asset price rise, supply chain issues, Ukraine-Russia war and many other factors it has gone out of control and is at 4-decade high levels of close to 8.30% (after breaching 9% as well in recent past)
- Initially, Fed was in denial mode – calling this a transitory phase. Only once they realised that this was not transitory but sticky inflation – here to stay for longer than expected – did they get into damage control mode. They changed their stance from neutral to hawkish and started raising rates very aggressively. At the same time, they have announced that they will do Quantitative Tightening (QT) v/s QE to the tune of almost $95 billion from September 2022 onward
- Rising Rates:
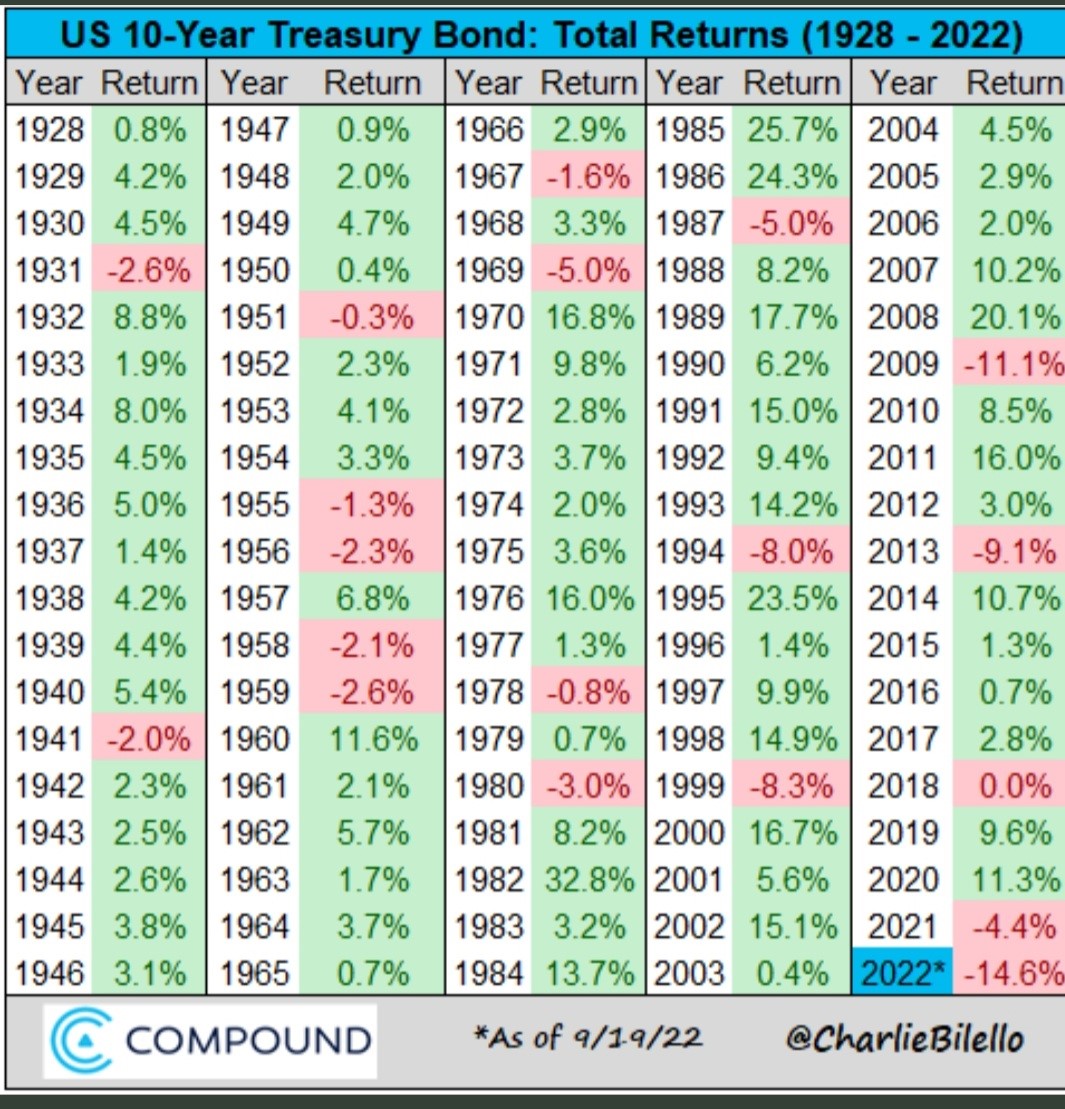
- Fed had kept interest rates at near zero levels for a very long period post COVID. However, they had to start raising rates due to realization of sticky inflation. 10 Year G Secs yields have shot through the roof over past 1 year. That’s the reason why Debt markets in US have seen their worst YTD performance. Fed is likely to raise rates once again on 21st September FOMC meeting by another 75 bps – their 3rd straight 75 bps hike (This note is penned before the Fed announcement). Many experts feel that there will be more rate hikes by 2023 – taking policy rates to above 4% mark
- So far, during near zero interest rate regime, narrative was TINA (There Is No Alternative) and hence Equities should do well. Also, higher PEs were justified stating that during zero interest rate scenarios, it’s norm rather than an exception. However, since interest rates have gone up and there is alternative for investors; funds will move out of equity markets and get parked in Risk Free alternatives like 10 Year G Secs with higher yields
- This can have significant impact on earnings of the Corporates going forward. This happens with a lag effect and will be visible in 2023 earnings downgrades. Add to that the possibility of Recession in US, China and Euro Zone countries – a classic mixture for slowdown in earnings once again
- Due to this, current PEs will start looking expensive once again (as the denominator will be lower due to lower earnings)
- Shiller PE Ratio:
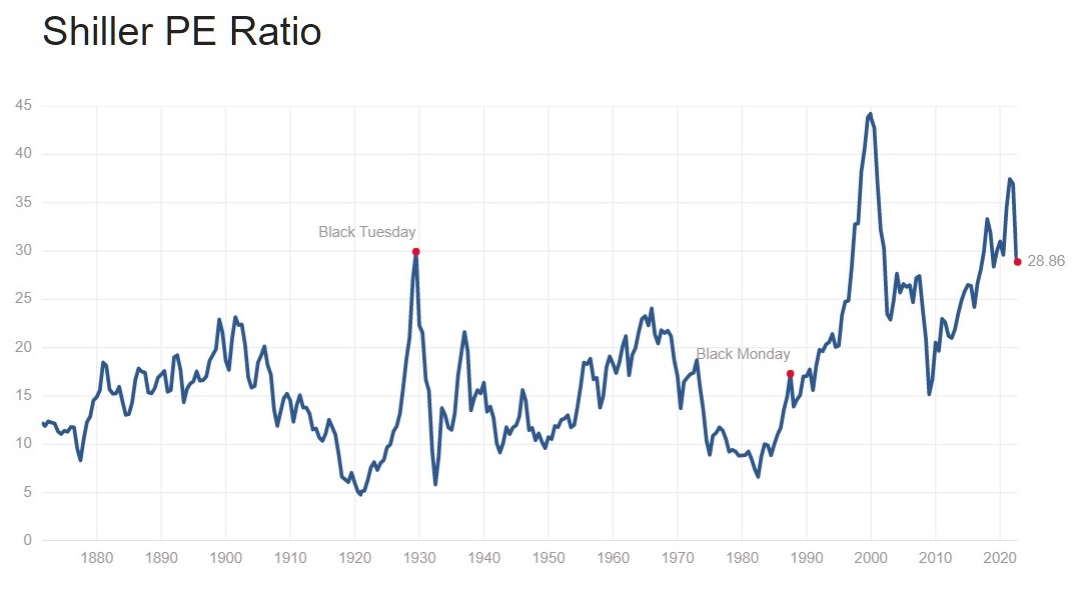
- Shiller PE Ratio is Price earnings ratio that is based on average inflation – adjusted earnings from previous 10 years
- Historical mean of this ratio has been around 17
- Currently it is at 28 + which once again indicates that valuations are not cheap and likely to become more expensive as earnings drop going into 2023
- Inverted Yield Curve:
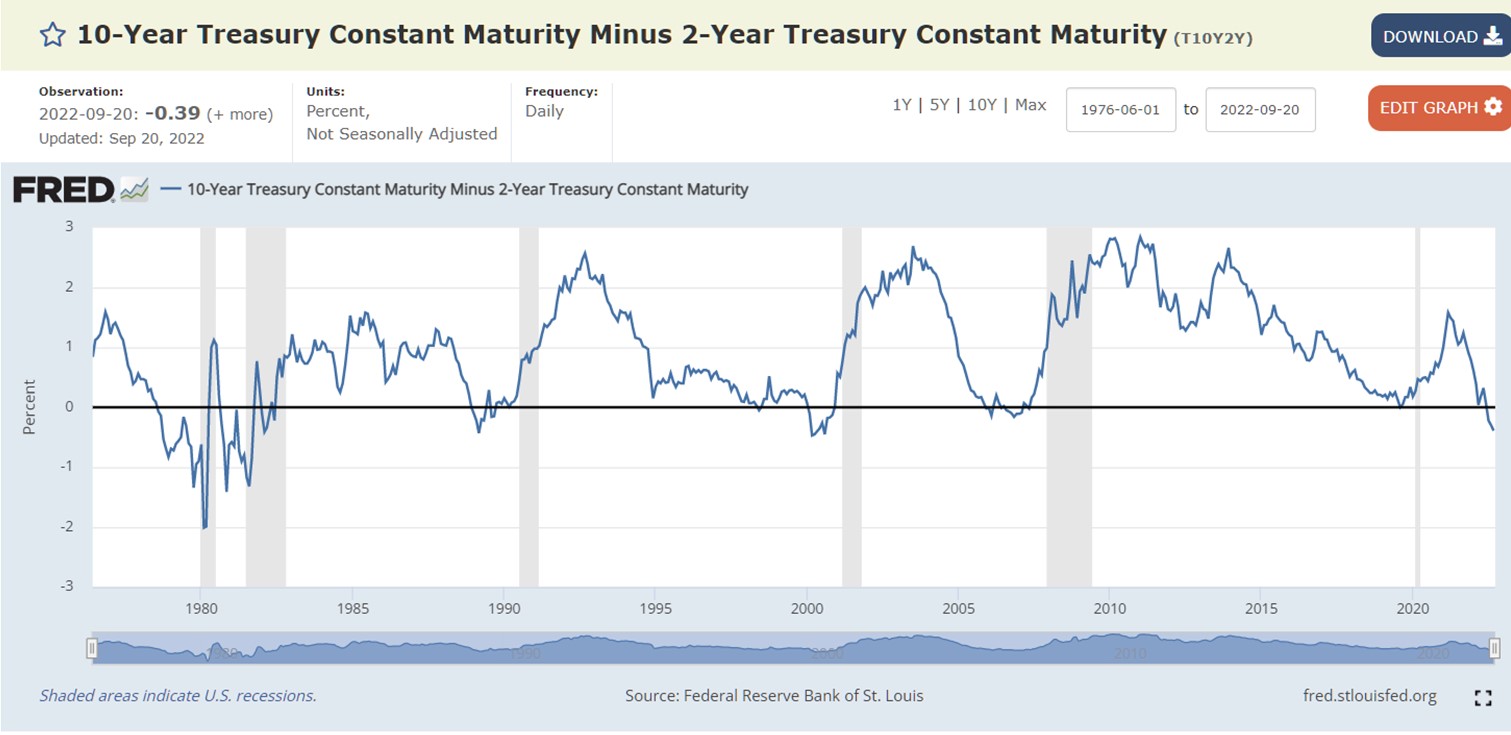
- The 10-2 Treasury Yield Spread is the difference between the 10-year treasury rate and the 2-year treasury rate. A 10-2 treasury spread that approaches 0 signifies a "flattening" yield curve. A negative 10-2 yield spread has historically been viewed as a precursor to a recessionary period. A negative 10-2 spread has predicted every recession from 1955 to 2018, but has occurred 6-24 months before the recession occurring, and is thus seen as a far-leading indicator
- When short-term interest rates exceed long-term rates, market sentiment suggests that the long-term outlook is poor and that the yields offered by long-term fixed income will continue to fall
- As the economic cycle begins to slow, perhaps due to interest rate hikes by the Federal Reserve, the upward slope of the yield curve tends to flatten as short-term rates increase and longer yields stay stable or decline slightly. In this environment, investors see long-term yields as an acceptable substitute for the potential of lower returns in equities and other asset classes, which tend to increase bond prices and reduce yields
- Banks generally borrow SHORT and lend LONG. When this spread becomes negative for them (when short term rates go up and their borrowing costs go up), they stop lending long to avoid this loss. This in turn dries up money supply, credit & slows down economy – leading to recession
- Yield Curve was inverted in 1980s, 2000 and now in 2022
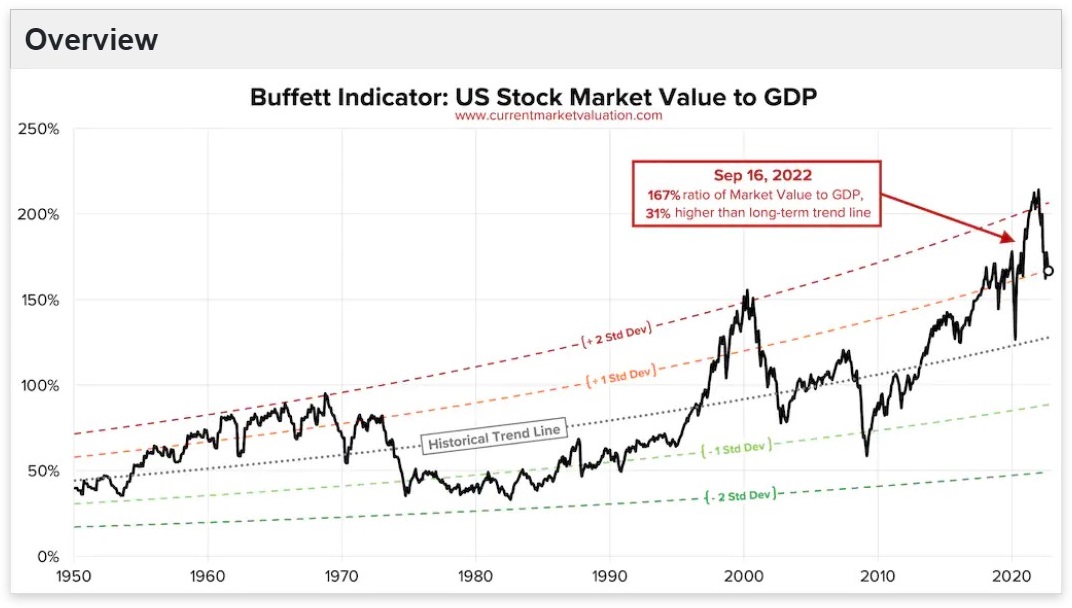
- Warren Buffett Indicator – Market Cap to GDP Ratio:
- The Buffett Indicator is the ratio of the total United States stock market to GDP. As of September 16, 2022 the ratio is calculated as:
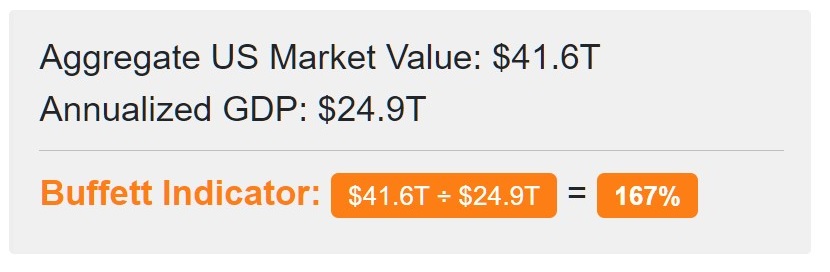
- This ratio fluctuates over time since the value of the stock market can be very volatile, but GDP tends to grow much more predictably. The average "trend line" value of the ratio is shown below. The current ratio of 167% is approximately 31% (or about 1.0 standard deviations) above the historical trend line, suggesting that the stock market is Overvalued relative to GDP
- Quantitative Tightening:
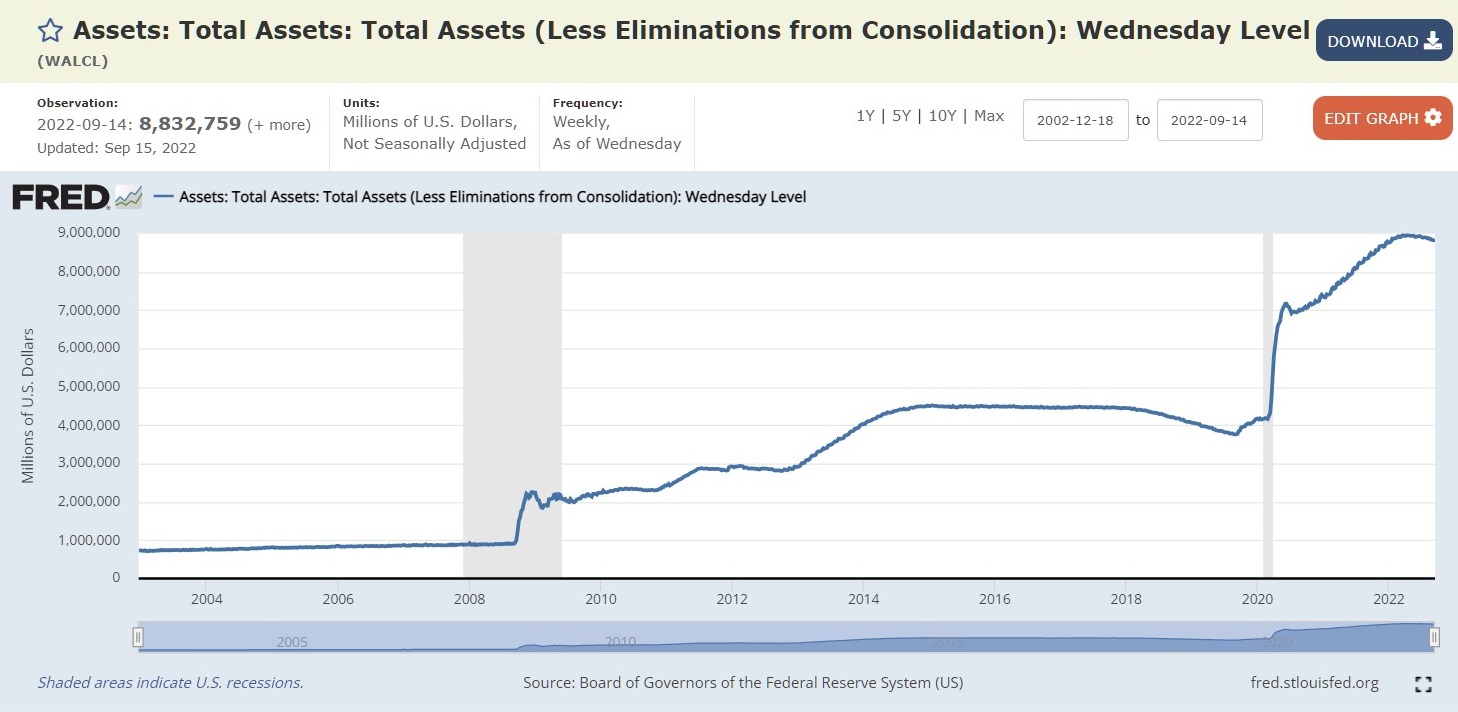
- Since 2008 Great Financial Crisis and Lehman Brother collapse, Fed and other Central Banks had resorted to Quantitative Easing (QE) where they were buying mortgage-backed securities from different banks’ balance sheets and pumping in liquidity to keep the Economy alive and kicking. They resorted to the same tactic post the COVID break out and ballooned their own Balance Sheet over a very short period of time as is visible from the Chart above
- Due to which US has seen one of the longest Central Bank – Liquidity driven bull run
- When Fed announced rate hikes and QT in 2018-19 to the tune of approx.$45 bln p.m.; markets tanked and Fed had to change their stance once again to being soft and dovish
- Now, to contain inflation, Jerome Powell has reiterated Fed’s stance of both – going aggressive on rate hikes and also QT of $95 bln p.m. from September-October 2022 onwards
- One can only imagine the implications this can have on not only US markets but global and emerging markets as well when funds will start to move out and liquidity starts to dry up
- As reported in Economic Times on September 20’2022, short term rates in India also surged as net surplus liquidity in the banking system nears zero and maybe going into deficit
In such a scenario as I have showcased based on various macro factors like
- Rising Dollar Index,
- Rising US treasury yields,
- Sticky inflation,
- Inverted yield curve & its implication of impending recession,
- QT & drying up of liquidity,
- Funds moving out of emerging markets due to this,
- 2 of the largest economies slowing down (taking other countries into recession as well),
- Geo-political disturbances due to Ukraine – Russia war, geo-political tensions brewing between China and Taiwan
Is it prudent to think that India will be insulated from Global deteriorating Macro and Geo-Political factors and carve a different path of its own? According to me, it will be too naïve to think that India will have no impact due to above factors, will have a smooth upward trajectory in the stock markets and all will be hunky dory for Indian investors. Volatility will be part and parcel for Indian investors in 2022-23.
But a big consolation is, when things come to normal, geo-political issues get resolved, India will bounce back better and faster than the other world economies due to much better macros and fiscal management.
My conclusion, suggestion, recommendation is not to get too carried away with India shining story, decoupling from Global factors theory, carving out its own upward trajectory story – and remain cautious at such uncertain times. Follow Asset Allocation, respect market valuations, do not follow BAAP (Buy At Any Price) philosophy and hope that markets will deliver returns to the investors from any levels. Apply COMMON SENSE, LOGIC and take your investment decisions.